Treasury Auction Slate: $125 Billion Refunding Led by 10-Year Notes
Treasury will sell $58 billion of 3-year notes, $42 billion of 10-year notes and $25 billion of 30-year bonds next week in a $125 billion Treasury auction.
WASHINGTON — The next Treasury auction cycle is set, and it is the one the bond market watches most closely. The Treasury Department announced on Wednesday that it will sell $58 billion of three-year notes, $42 billion of 10-year notes and $25 billion of 30-year bonds in the quarterly refunding, a package that adds up to $125 billion. All three securities settle on November 16.
The sizes match what the department offered in August, when the refunding also totaled $125 billion. What changes from quarter to quarter is the split between money that simply replaces maturing debt and money that is new to the Treasury’s cash balance, and that split is what the auction slate is really about.
How the refunding is built
Roughly $97 billion of privately held Treasury securities mature on November 15, according to TreasuryDirect data on the maturing issue. Treasury’s estimate is that the $125 billion of auctions will raise about $28 billion of new cash on top of that rollover. In August, the comparable figures were about $96.3 billion of maturing private holdings and about $28.7 billion of new cash.
The total amount, in other words, did not move. The slightly larger rollover requirement this time simply leaves a little less room for fresh borrowing within the same $125 billion. Readers should not treat the full figure as new borrowing: most of it refinances debt already outstanding.
The auction calendar
The three sales run back to back in the week of November 9:
- Three-year notes, $58 billion, with bidding closing on Monday, November 9.
- 10-year notes, $42 billion, closing Tuesday, November 10. This is a new issue maturing November 15, 2036, not a reopening.
- 30-year bonds, $25 billion, closing Thursday, November 12.
Each is a single-price auction, so every winning bidder pays the same yield, set by the highest accepted bid. Results for each sale come out shortly after the 1 p.m. Eastern close.
What the last coupon week showed
The refunding follows the end-of-month sales of two-, five- and seven-year notes, which give the cleanest read on where buyers stood just before the new supply. The two-year note, $69 billion, cleared at a high yield of 4.708% with a bid-to-cover ratio of 2.59. The five-year, $70 billion, priced at 4.845% and drew 2.33 times the amount offered. The seven-year, $44 billion, came at 4.894% with a bid-to-cover of 2.46.
Bid-to-cover is total competitive bids divided by the amount awarded; a lower figure means less surplus demand at the clearing yield. The five-year drew the thinnest cover of the three, and bidders at the high yield received 98.6% of the amount they bid for, meaning the auction cleared with demand at the top of the range almost fully filled. That is the kind of detail dealers will compare against the new 10-year next week.
What it means for the curve
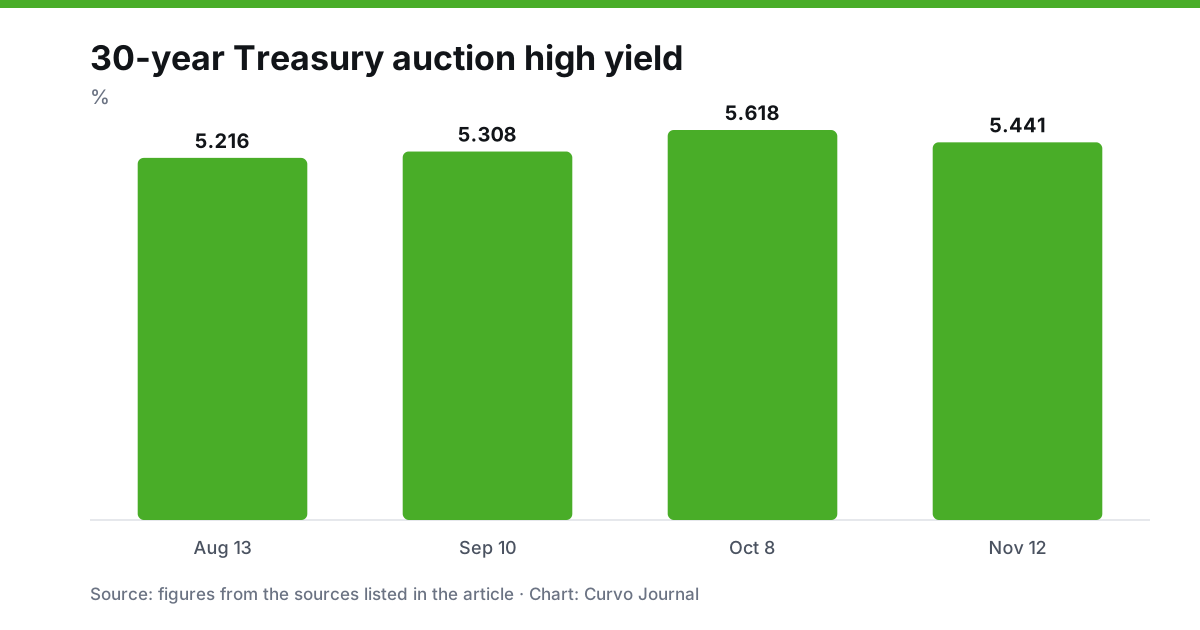
Nothing in the announcement alters the supply picture: sizes are unchanged from August. That leaves the pricing to investors. The August refunding sold 10-year notes at 4.683% and 30-year bonds at 5.216%, and next week’s auctions will show how much extra yield buyers want to absorb the same dollar amount.
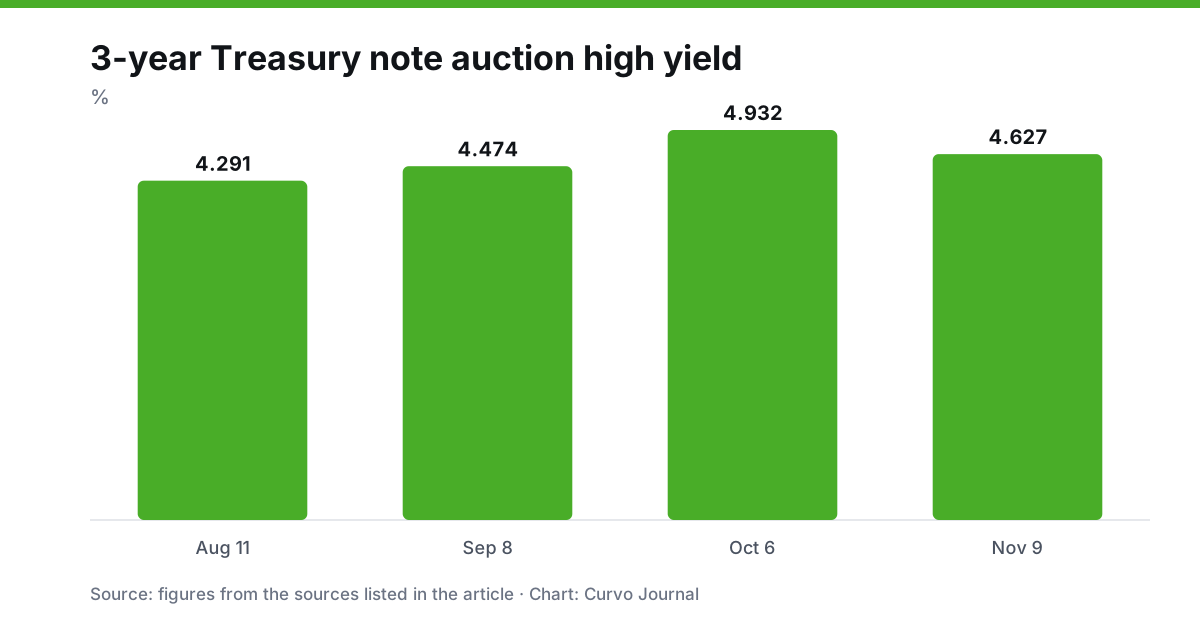
For the yield curve, the three-year sale is the short-end marker, the 10-year the benchmark, and the 30-year the measure of appetite for duration. Taken together they trace the middle and long end of the curve in a single week.
What to watch
Three things matter in each result: the high yield against where the security traded just before the bidding closed, the bid-to-cover ratio, and how the awards split among direct bidders, indirect bidders and primary dealers. A weak result at one maturity does not predict the next, since the buyer base differs along the curve, but a run of soft ones would be hard to ignore.
Prepared with AI assistance from public sources and reviewed under our editorial policy. Not investment advice.