Fed Dot Plot Sees 4.1% Rates Through 2027, Testing the Yield Curve
The Fed's September projections lift the median policy rate to 4.1% for 2026 and 2027, from 3.8% and 3.6% in June, with consequences for the yield curve.
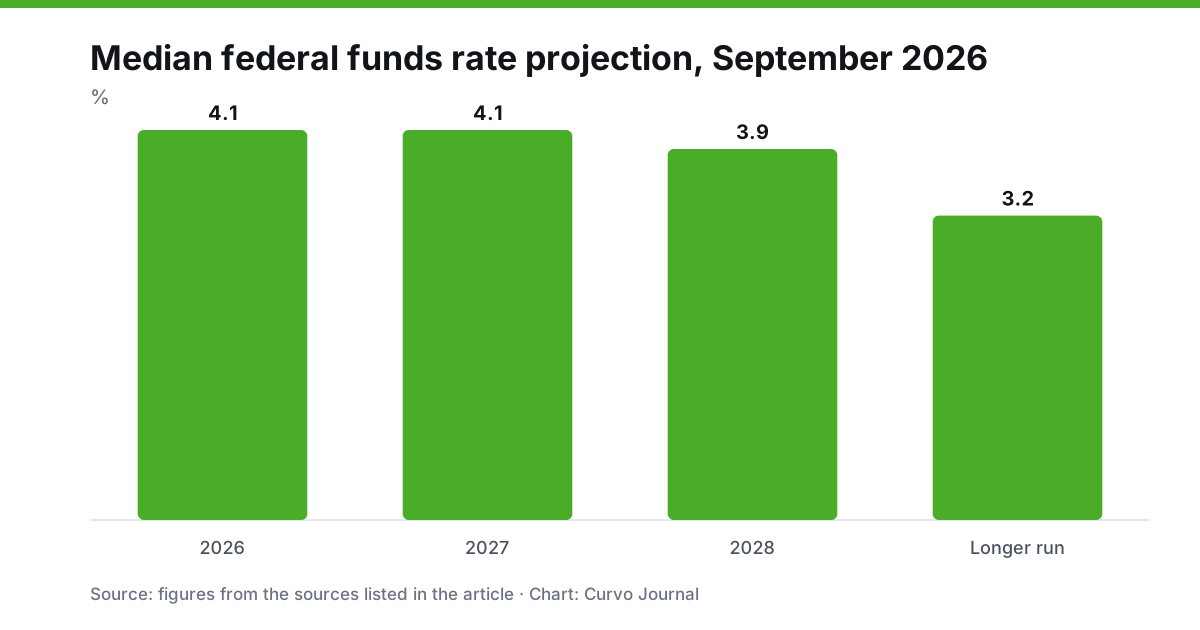
WASHINGTON — Federal Reserve officials now see the federal funds rate at 4.1 percent at the end of both 2026 and 2027, a sharp upward revision from June, according to the Summary of Economic Projections released Wednesday alongside a quarter-point rate increase. The shift moves the central bank’s expected path well above where it stood three months ago and sets a new reference point for the yield curve.
Key takeaways
- The FOMC raised the target range 25 basis points to 3-3/4 to 4 percent in a 12-0 vote.
- The median 2026 rate projection rose to 4.1 percent from 3.8 percent in June; the 2027 median jumped to 4.1 percent from 3.6 percent.
- Median PCE inflation for 2026 is 3.7 percent, up from 3.6 percent, with core at 3.4 percent.
- The longer-run rate median edged up to 3.2 percent from 3.1 percent.
The projections in detail
The September medians show growth slightly stronger and unemployment lower than in June. Real GDP is projected to expand 2.3 percent in 2026 and 2.4 percent in 2027, against 2.2 and 2.3 percent previously. The unemployment rate median is 4.1 percent for 2026 through 2028, compared with 4.3 percent for 2026 and 2027 in June.
Inflation is expected to run hotter this year and cool more slowly. Median PCE inflation is 3.7 percent in 2026, 2.3 percent in 2027 and 2.1 percent in 2028, slightly above June in the final year. Core PCE is 3.4 percent this year, 2.5 percent in 2027 and 2.2 percent in 2028.
The rate path is where the revision is largest. The 2028 median rose to 3.9 percent from 3.4 percent. In the dot plot, 12 of 18 participants placed 2026 at the 4.125 midpoint, 4 at 4.375 and 2 at 3.875. For 2027, eight sat at 4.375 percent and six at 4.125 percent, with only four below 3.75 percent. Officials are therefore not simply pricing one hike; a majority see policy staying near 4 percent or higher into 2027.
What the statement said
The committee’s statement described activity as expanding at a solid pace, with resilient domestic spending despite elevated uncertainty partly tied to geopolitical developments. It noted strong productivity growth and strong capital investment, and said job gains have kept pace with the workforce. Inflation remains elevated, and the committee said the increase is intended to support a timelier return to its 2 percent goal. It also said it will continue maintaining ample reserves.
Reading the yield curve
The projections matter to Treasury yields in two ways. First, a policy rate of 4.1 percent through 2027 anchors the front of the curve above current levels, because the 2-year yield tracks expected policy over that horizon. Second, the gap between the 4.1 percent medians and the 3.2 percent longer-run estimate implies officials expect rates to come down eventually, which limits how much the hawkish path should lift long maturities by itself. That tension is why traders will watch whether the 10-year, which cleared its September 9 auction at 4.834 percent, steepens or flattens against shorter maturities in the coming sessions.
How the dots shifted
Because the dot plot records individual forecasts, the distribution says as much as the median. All 18 participants placed the end-2026 rate at or above 3.875 percent, and 16 of them at 4.125 percent or higher, which matches a federal funds range of 3-3/4 to 4 percent plus one further quarter-point increase before year-end. By 2028, participants spread more widely: four sit at 4.125 percent and four at 3.125 percent, with seventeen submitting. That dispersion helps explain the 3.2 percent longer-run median, which is below every near-term median and implies officials expect policy to settle below its current range over time, even as they raise it now.
Compared with June, the 2027 median moved by half a percentage point, from 3.6 percent to 4.1 percent. Together with the same-sized revision to 2028, that is the largest upward move in the table, and it shifts the focus from this year’s hike to how long rates stay high.
What to watch
The Treasury’s end-of-month 2-, 5- and 7-year note auctions will test demand for duration at the new rate levels. Incoming inflation and jobs data will determine whether the 4.1 percent median holds or is revised again at the next projection round.
Prepared with AI assistance from public sources and reviewed under our editorial policy. Not investment advice.